
Dashboard #
The portal features a Dashboard section that provides a convenient overview of your data usage, workflows, their progress and statistics, resource usage, and upload progress. If you need to monitor how the members of your project are using the assigned resources, this is the section to go to.
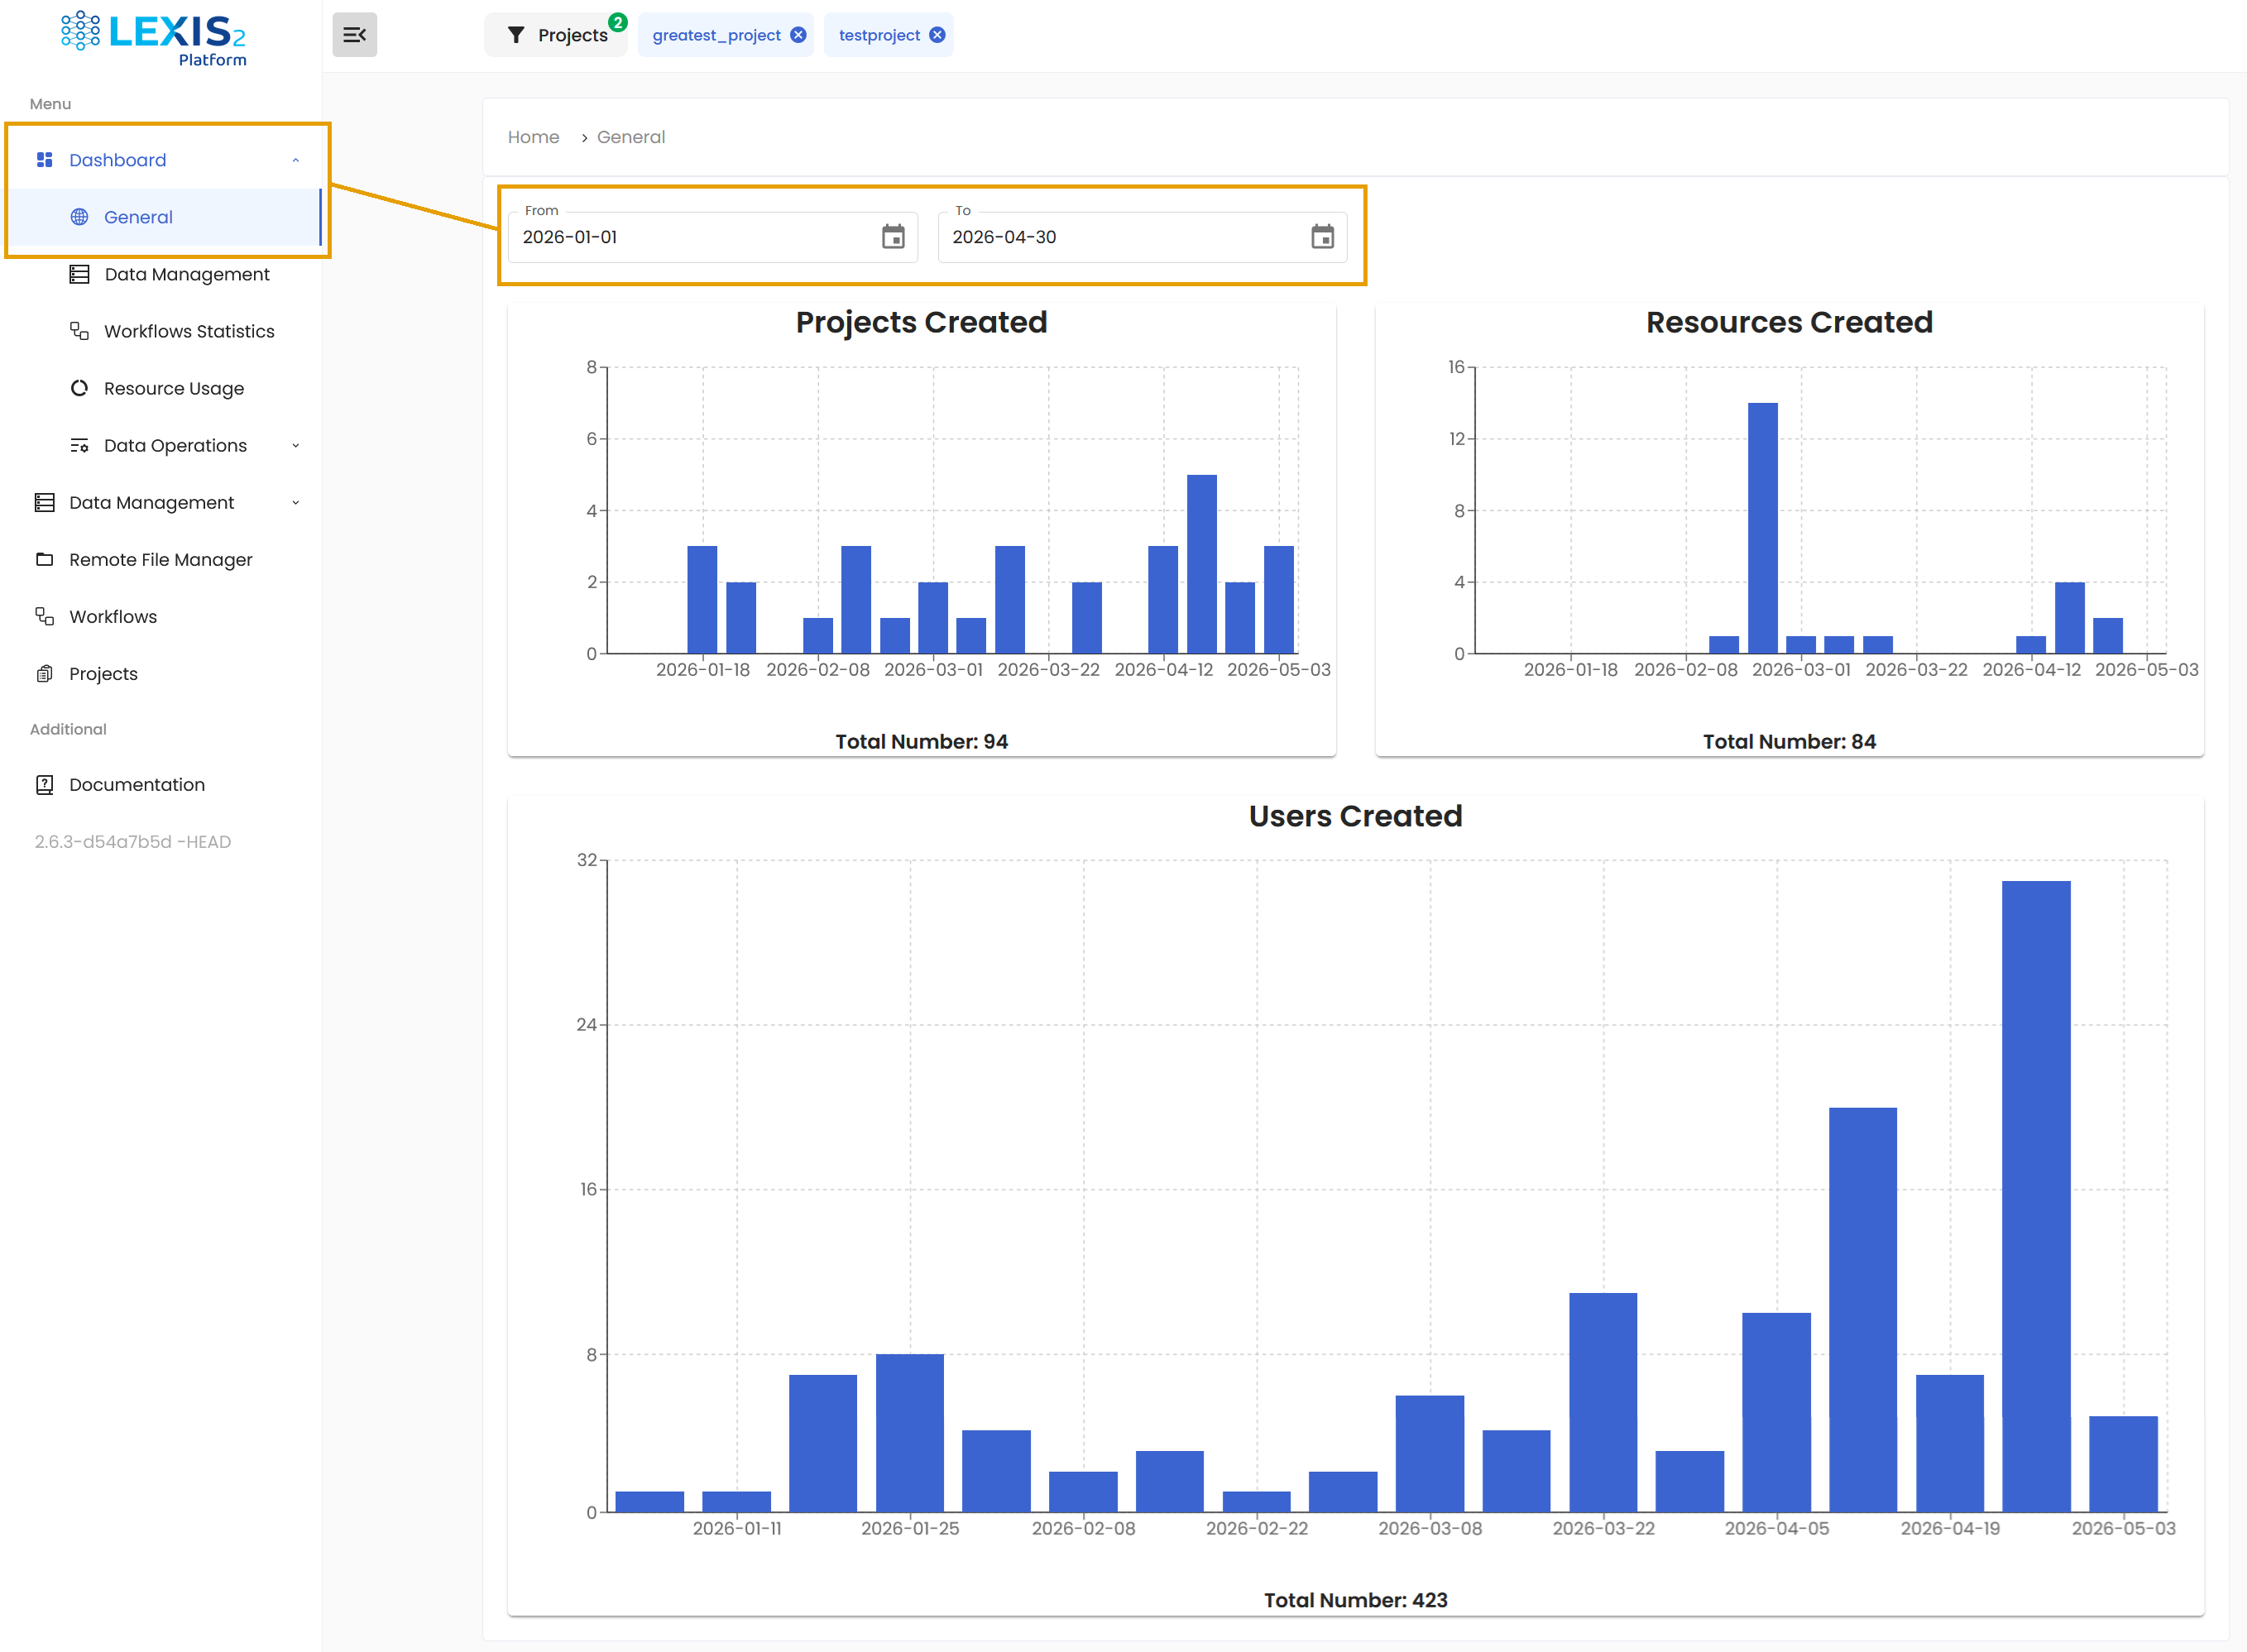
General#
The Dashboard/General section contains a widespread view at the platform. You can see how many projects, resources and users were created in the selected time frame.
Data Management#
In the Dashboard/Data Management, there is an overview about the data usage. For each project, you can monitor how are your assigned resources used. There are two types of categories you can supervise: Metrics and Resource statistics.
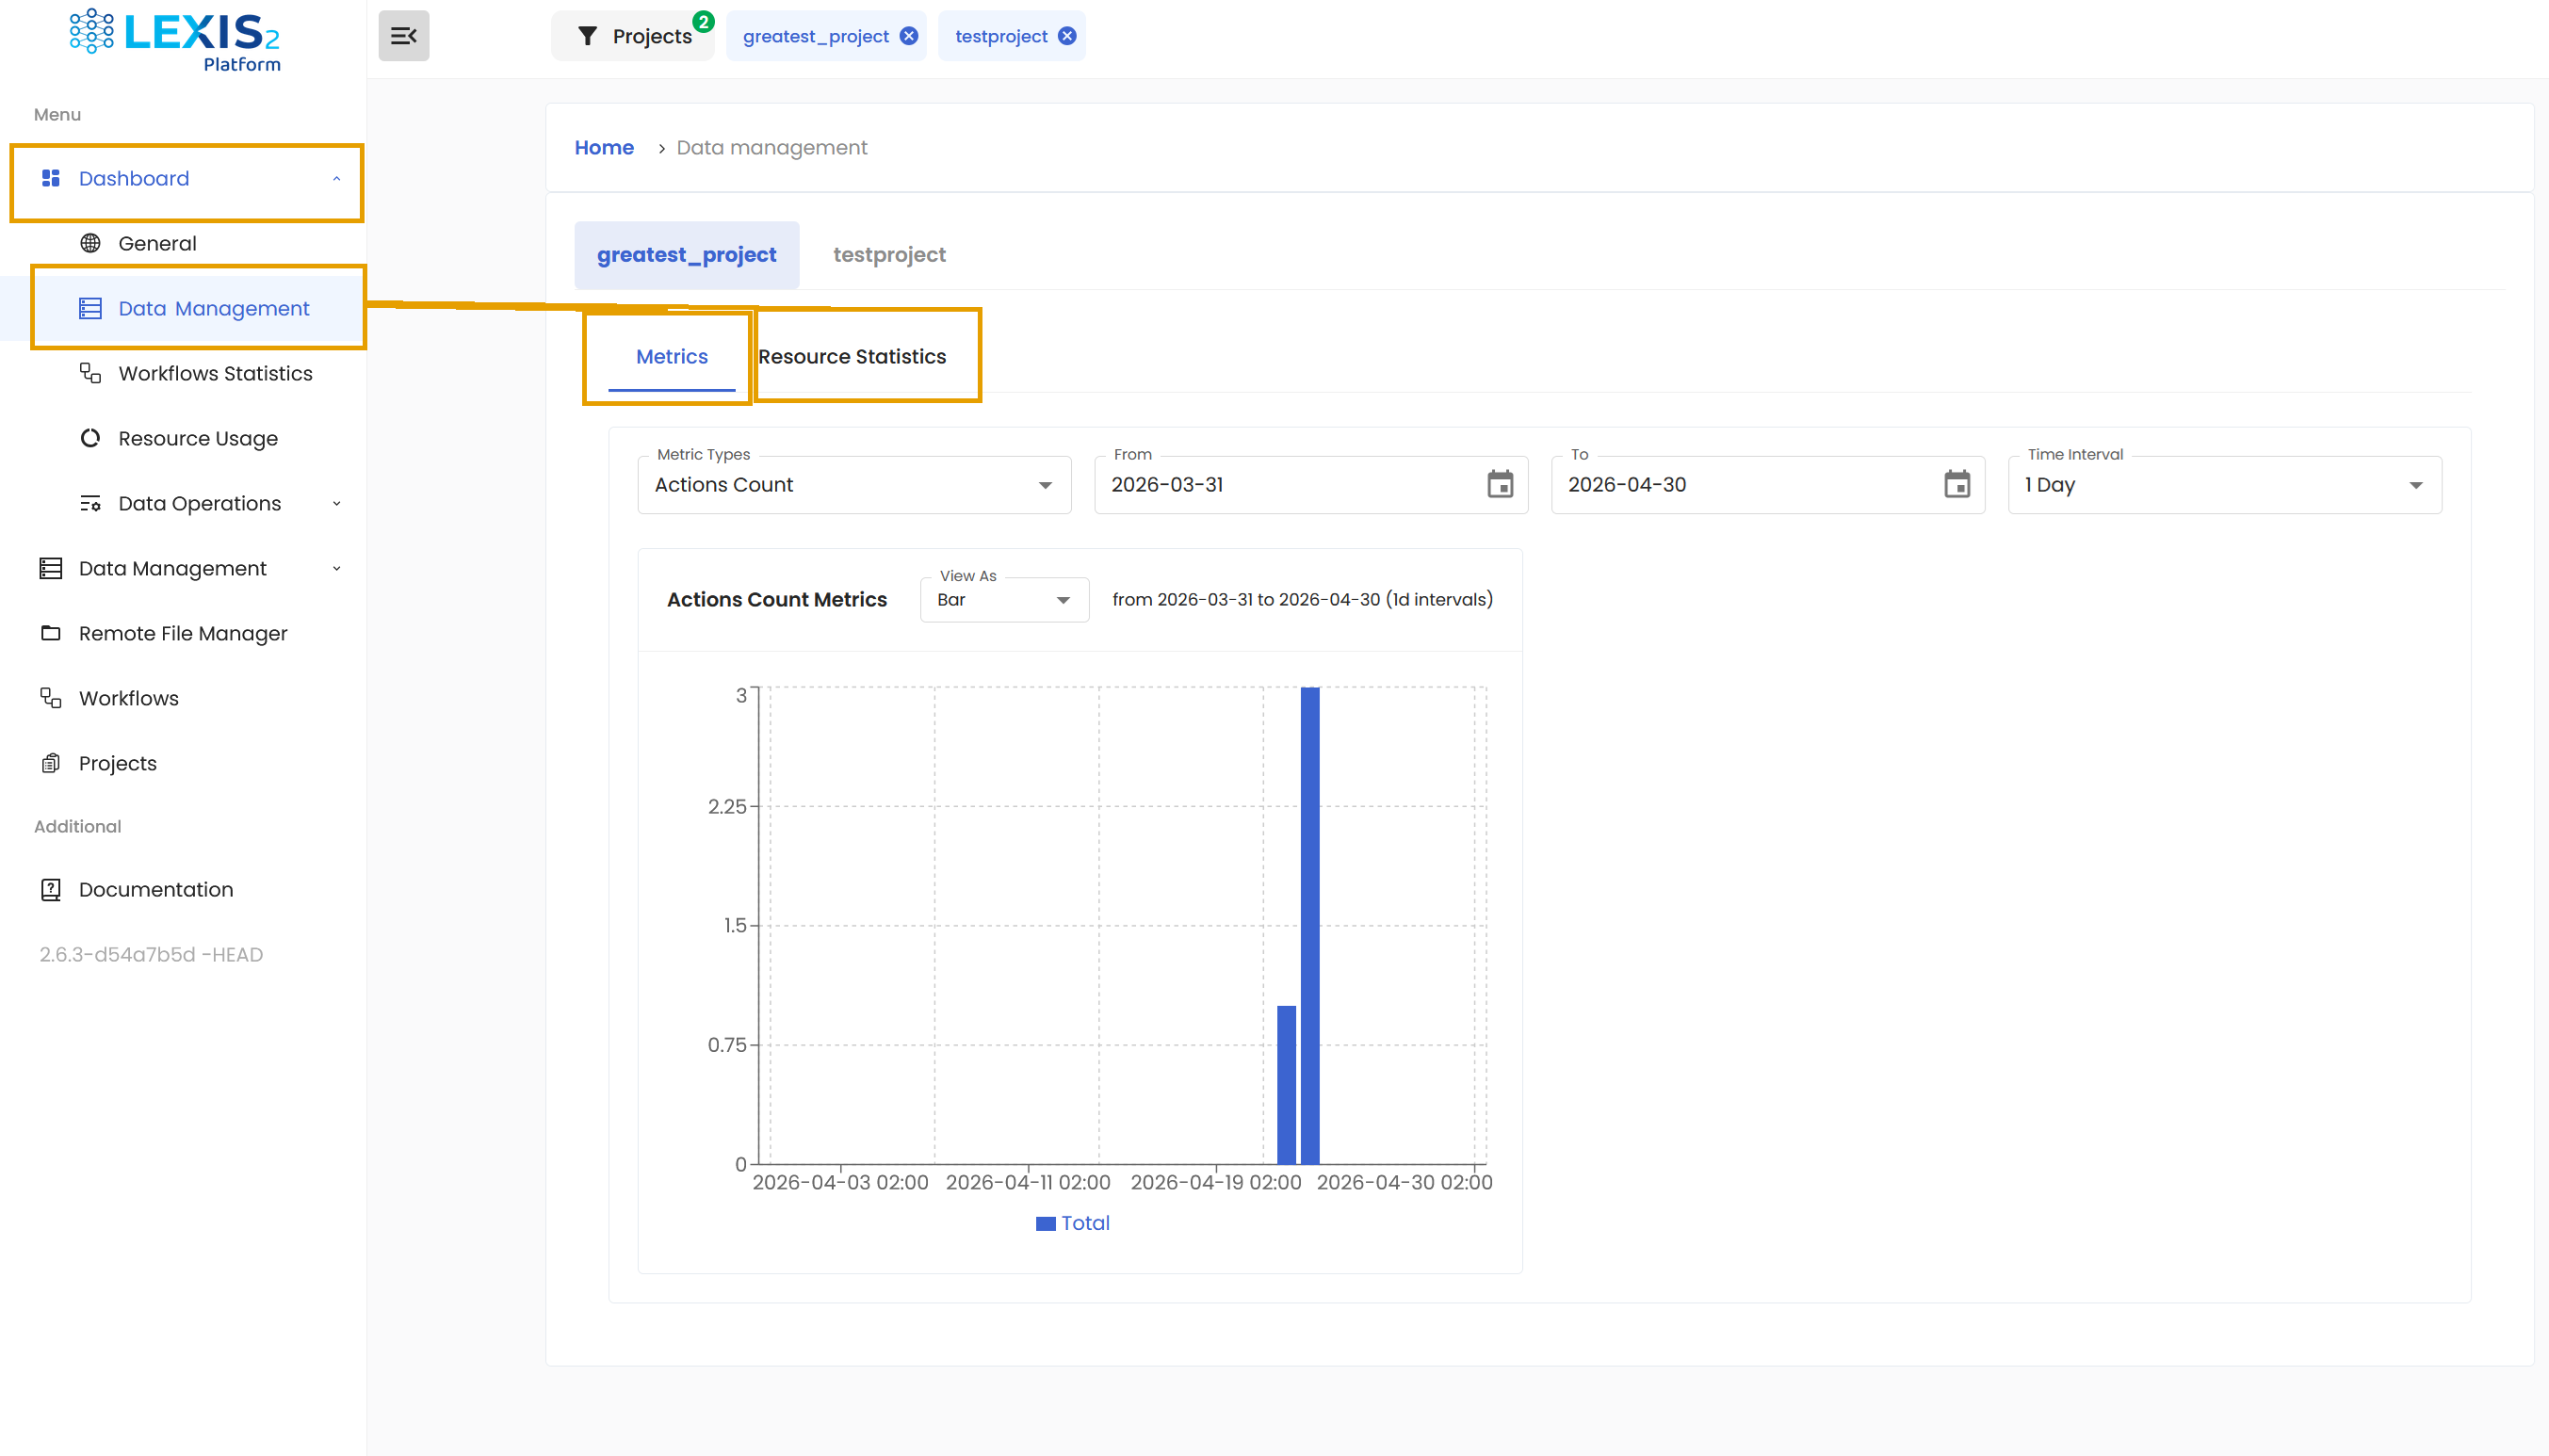
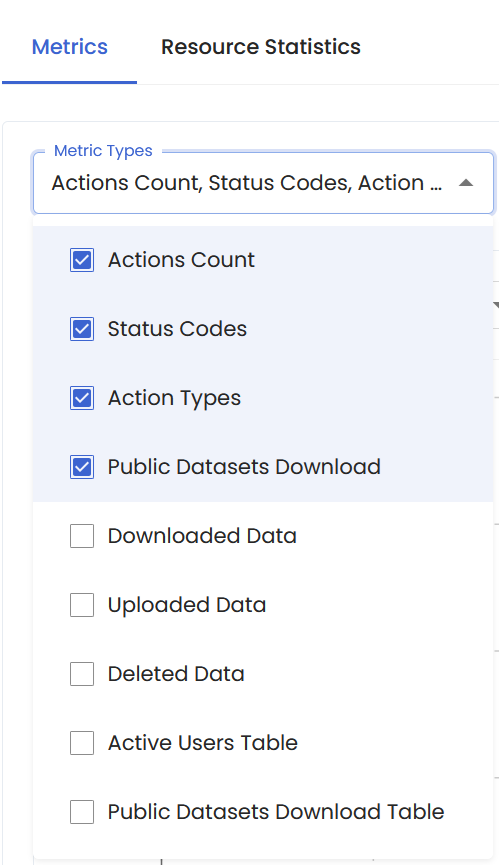
The Metrics tab allows you to monitor various facets of the project. You can choose which types of metrics are displayed in the dropdown.
You can also set the monitored period and the time step to control how detailed overview you receive.
Important
The Metrics statistics are only available to Project manager and Project owner.
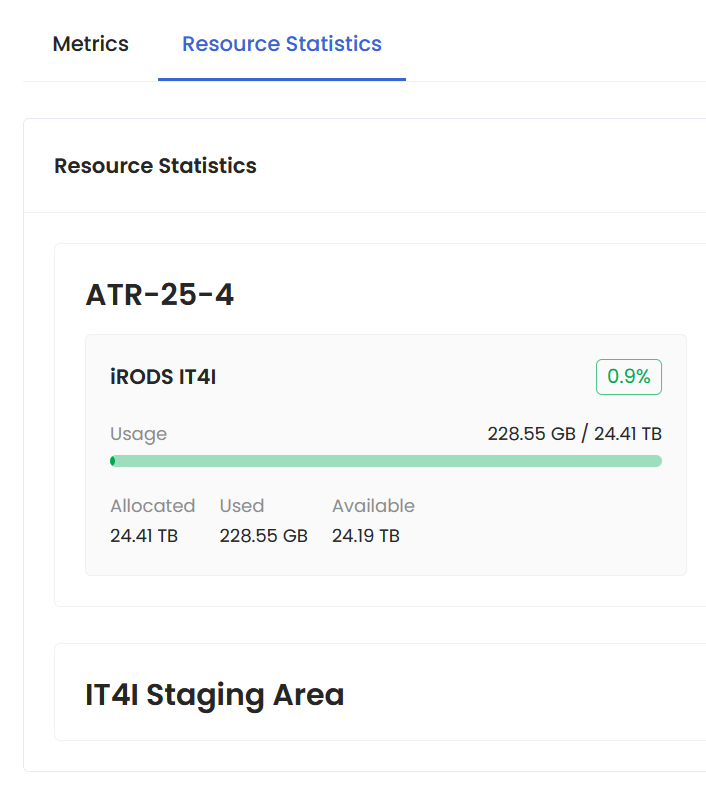
In the Resource Statistics tab, you can check how many resources the project can access and how many are currently in use.
Workflow Statistics#
In the Dashboard/Workflow Statistics section, there are statistics for all your available workflows. You can find how many times your workflows were executed and how they ended. Or even if they are still running or waiting in the queue.
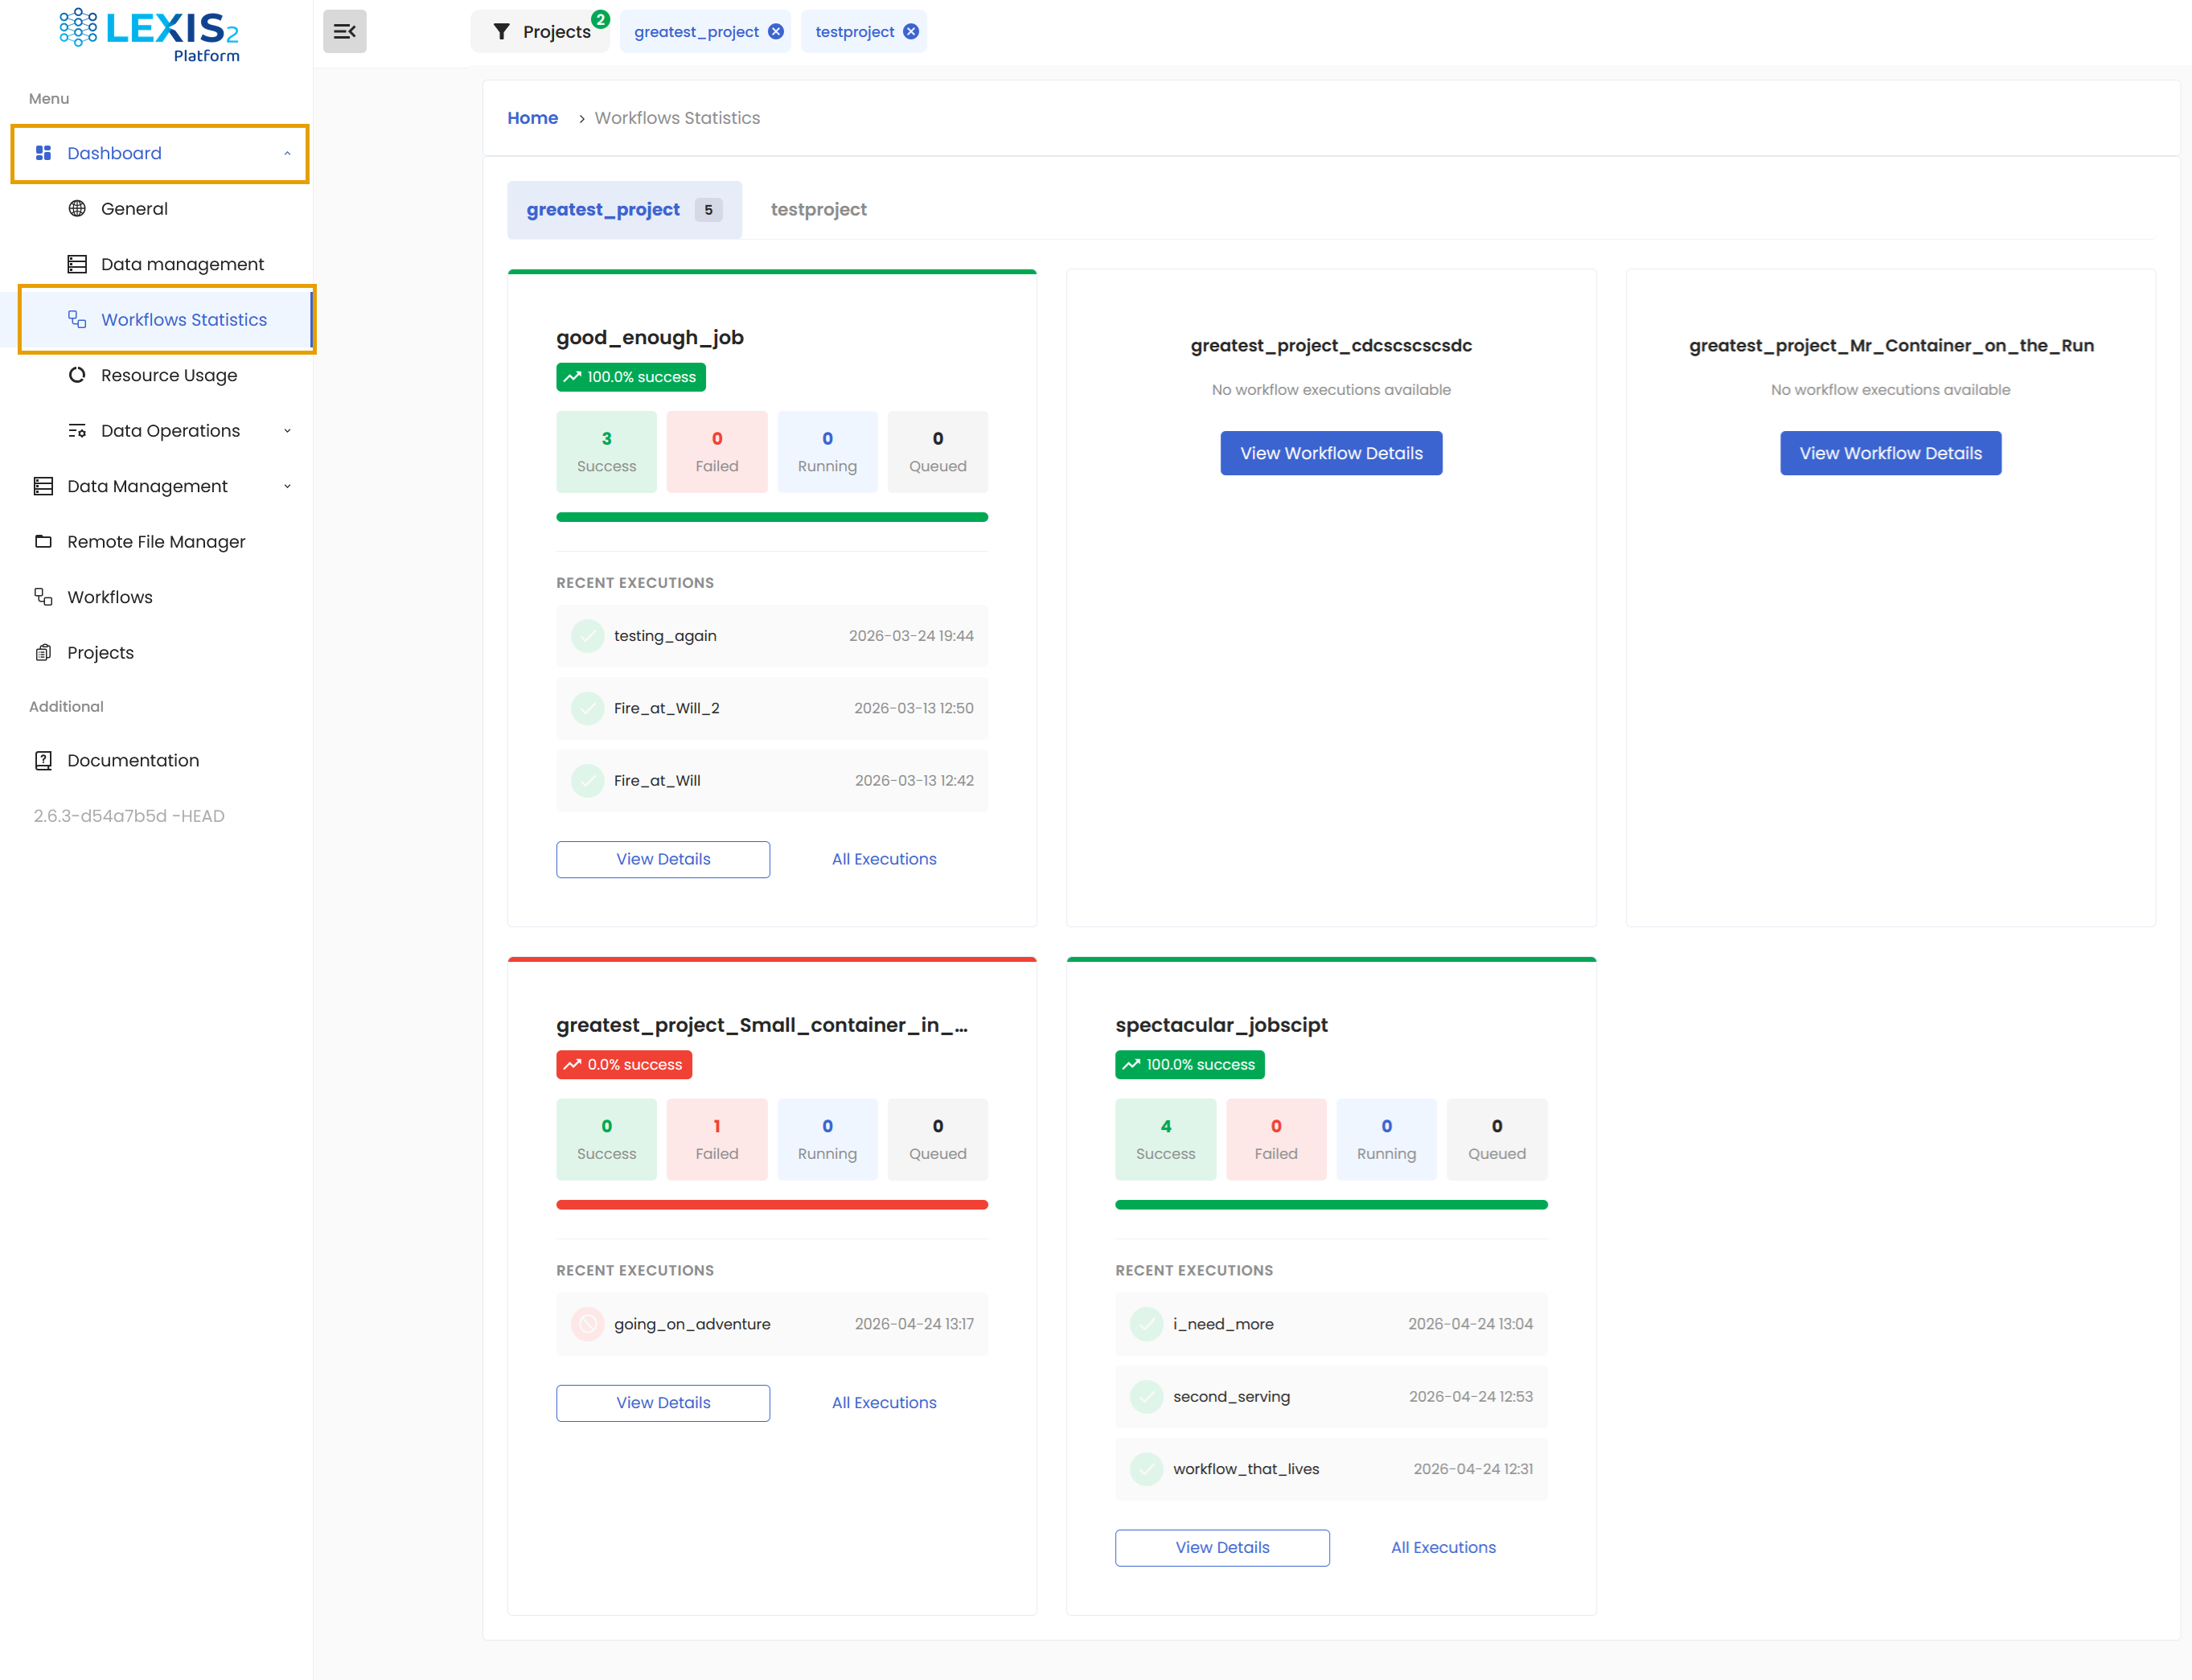
Tip
The information is kept only on existing workflows. Once you delete your workflow, it will dissappear from the dashboard as well.
The View Details and All Executions buttons will take you to the details about your workflow in the Workflows section that is more described here: Execution of LEXIS Workflows.
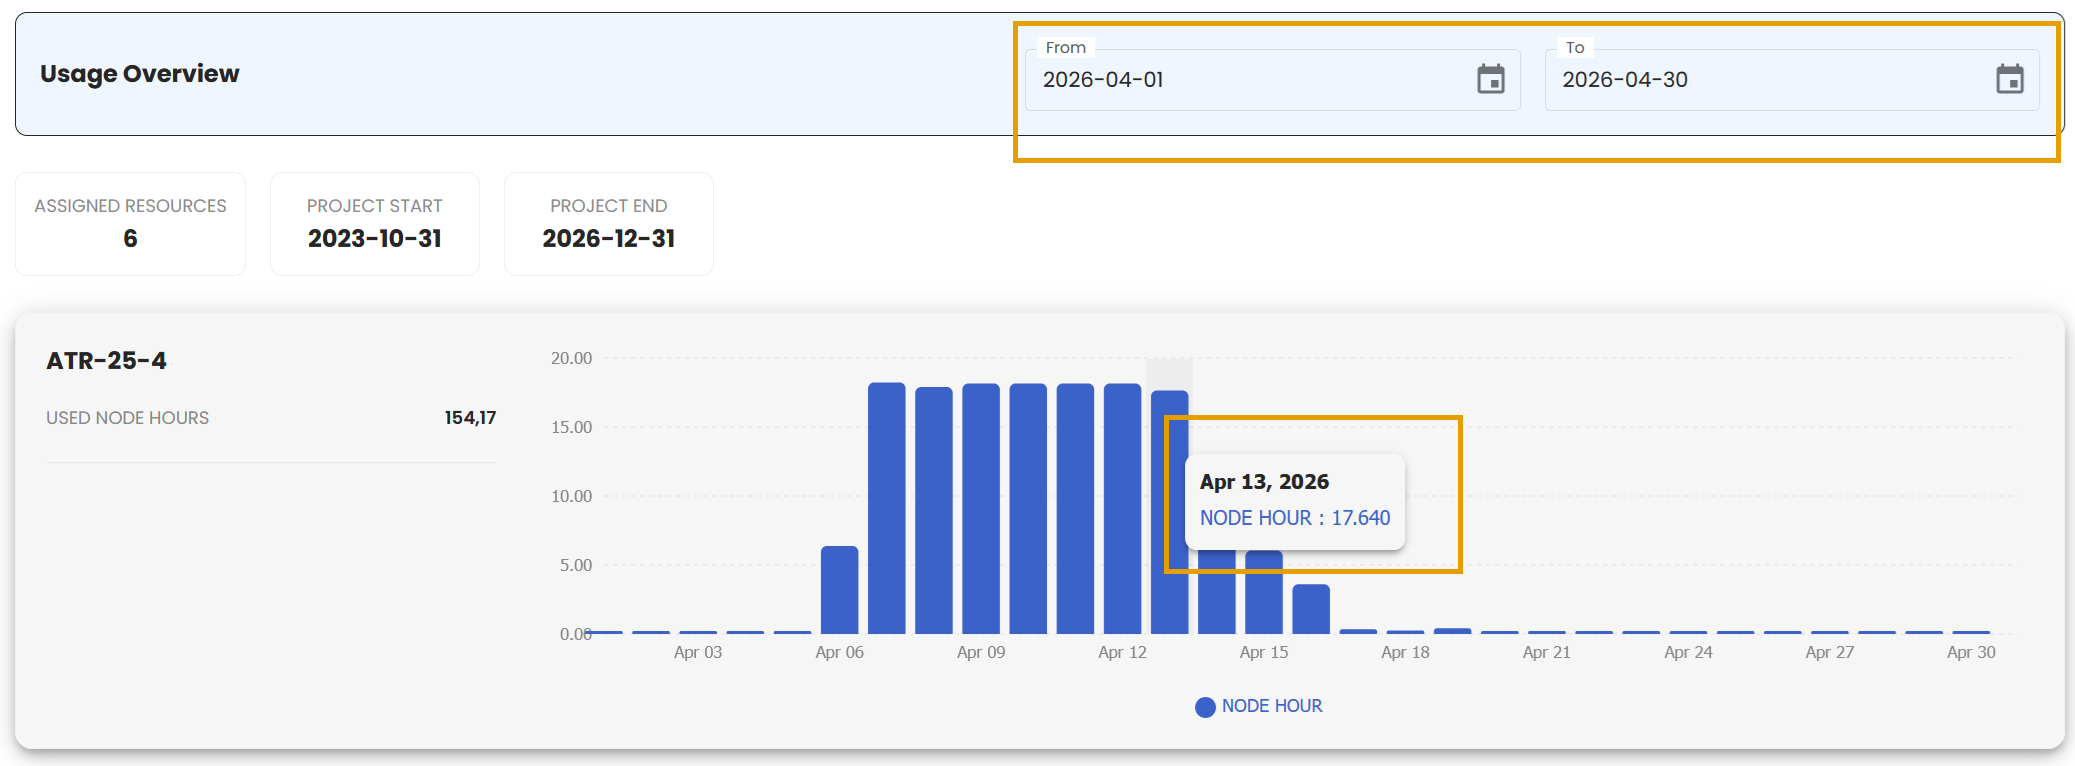
Resource Usage#
In the Dashboard/Resource Usage, you can find the detailed overview of how are resources consumed per resource assigned to the project.
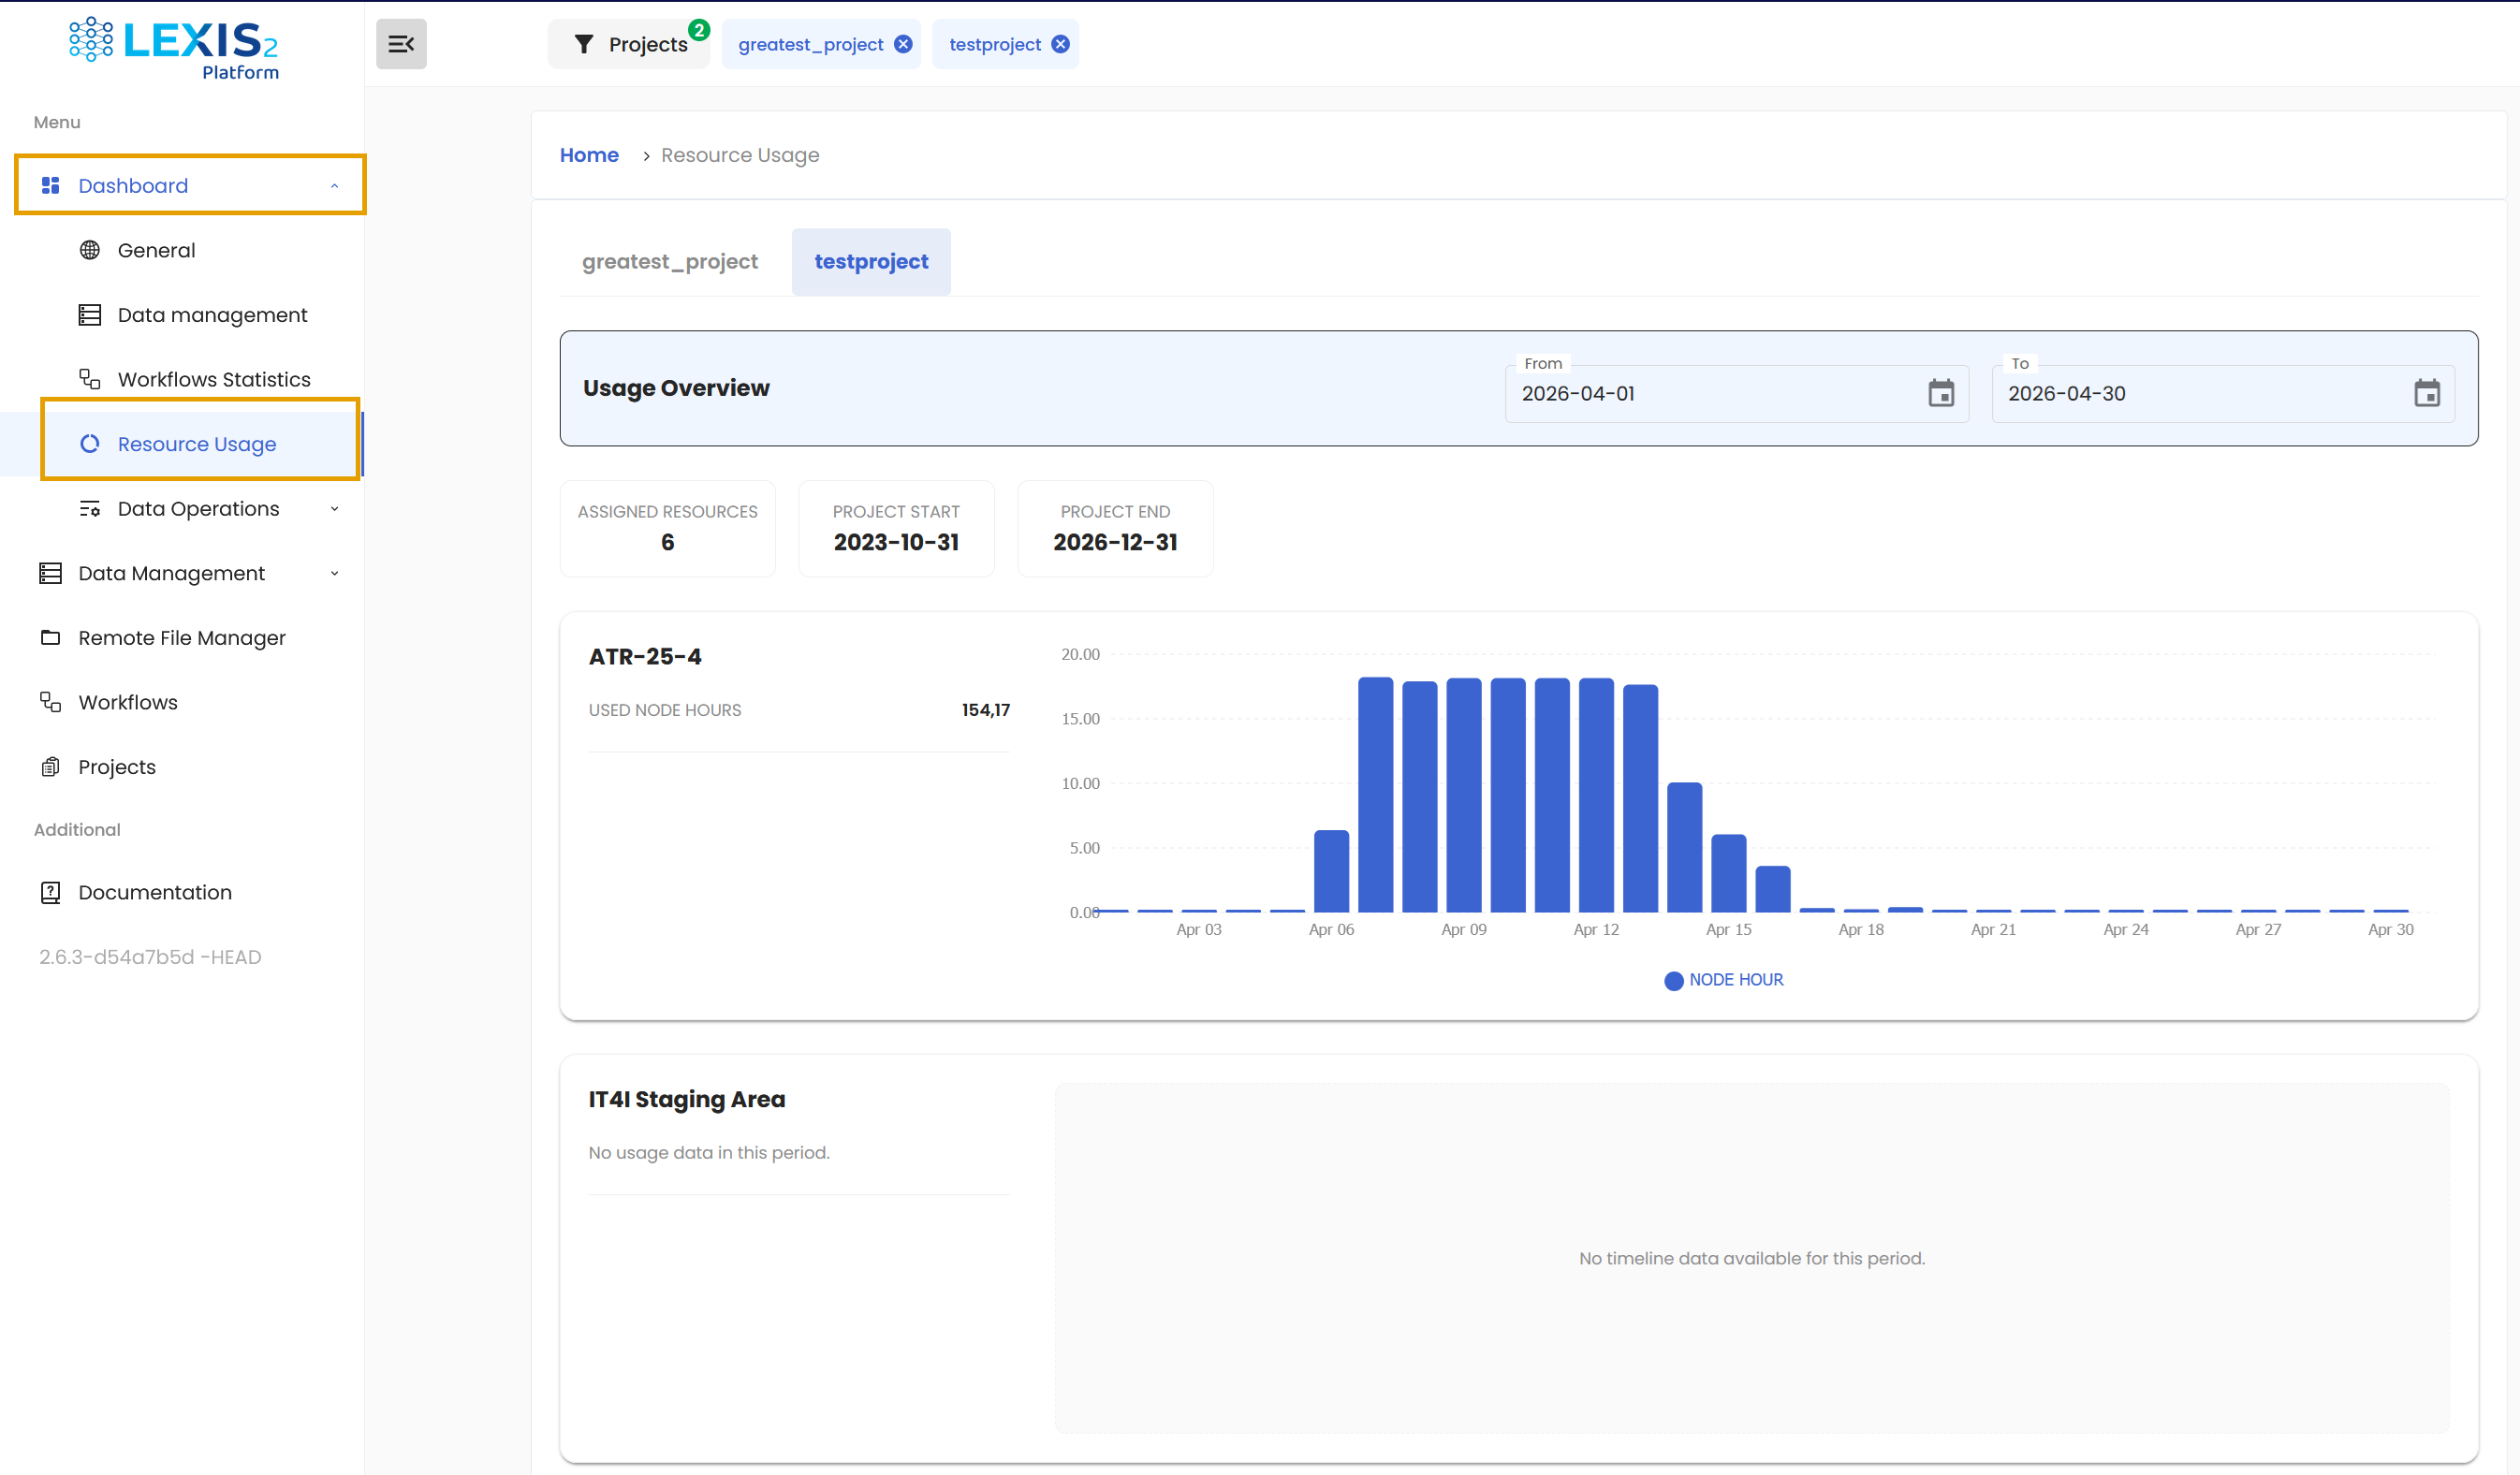
You can limit or enlarge the time window to monitor exactly what you need. And if you mouse over the graph, you will get more precise information.
Data Operations#
The Dashboard/Data Operations section exists to help you track the state of your uploads and deletes. Some objects might take too long to upload and in case where you close the upload window, you can monitor the progress from here. You can also view the history of the files you have uploaded and deleted.